December 2024 Market Insights

December 2024 Market Insights – Watch GVR December 2024 overview of housing market activity in Metro Vancouver.

Home sales registered on the Multiple Listing Service® (MLS®) in Metro Vancouver1 rose over thirty per cent in December, compared to the previous year, signalling strengthening demand-side momentum to close out 2024.

The Greater Vancouver REALTORS® (GVR)2 reports that residential sales in the region totalled 26,561 in 2024, a 1.2 per cent increase from the 26,249 sales recorded in 2023, and a 9.2 per cent decrease from the 29,261 sales in 2022.

Last year’s sales total was 20.9 per cent below the 10-year annual sales average (33,559).

“Looking back on 2024, it could best be described as a pivot year for the market after experiencing such dramatic increases in mortgage rates in the preceding years. With borrowing costs now firmly on the decline, buyers have started to show up in numbers after somewhat of a hiatus and this renewed strength is now clearly visible in the more recent monthly data.” — Economics and Data Analytics

* Areas covered by the Real Estate Board of Greater Vancouver include: Bowen Island, Burnaby, Coquitlam, Maple Ridge, New Westminster, North Vancouver, Pitt Meadows, Port Coquitlam, Port Moody, Richmond, South Delta, Squamish, Sunshine Coast, Vancouver, West Vancouver, and Whistler.

Sales-to-active listings ratio for December 2024

Generally, analysts say downward pressure on home prices occurs when the ratio dips below 12 % for a sustained period, while home prices often experience upward pressure when it surpasses 20% over several months. You can see more details on Greater Vancouver Realtors®.

Detached Houses for sale, houses for sale, Residential properties

12.1 % – Balanced Market

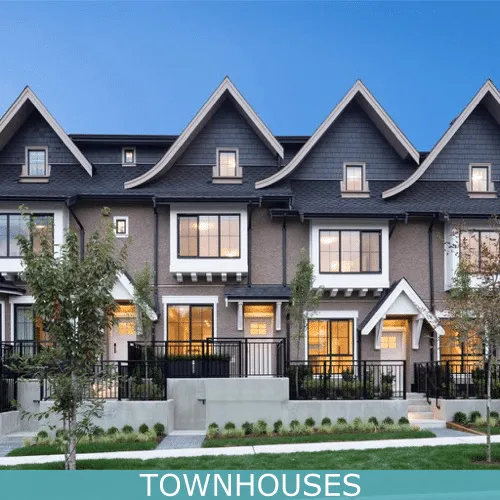
New Listings Townhouses for Sale

23.6 % – Seller’s Market

New Listings Condos for sale, Residential properties

18.7 % – Balanced Market

Check our Market Statistics page to see detailed December 2024 market insights for Greater Vancouver & Fraser Valley, broken out by city and housing type (detached homes, condos, townhouses) .  The movements in prices, sales, number of days a listing is on the market, and sales to active ratio by city will give you a real understanding of how the market is shifting neighbourhood by neighbourhood.   This is really important:  Greater Vancouver is made up of a lot of local markets, which can move very differently!  For example, the market might be HOT in Maple Ridge and slow in Vancouver, or HOT for condos and slow for detached homes… and it is shifting all the time!  Sometimes the shifts are small, other times they are very significant.  We track movements across the entire region – contact us for further insights!

Check our other blogs under Videos  – that might give you answers about buying or selling a home.

If you are interested in Real Estate in general, and want to get updates, check out our:

If you plan on Buying a home:

If you plan on Selling your home:

  • Check first what our clients are looking for on Sell my house FAST page. Our clients are qualified and ready to write offers at the market price!
  • Check the Listing Prices and the Sell Prices of similar properties in your neighbourhood on the Search by Map page.