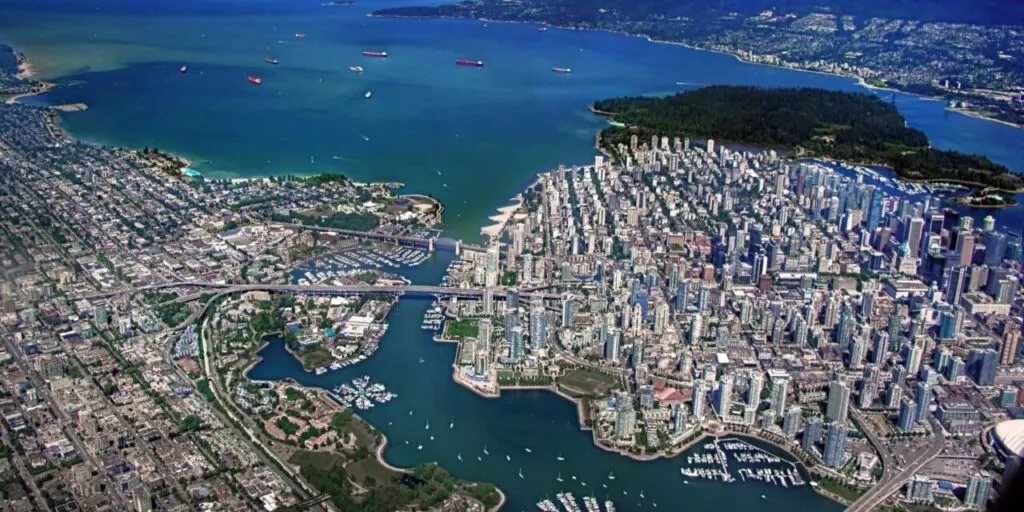
Metro Vancouver Growth Projections
Population is the most commonly applied element in regional growth projections and provides a basis for projecting housing, employment and related land use. Metro Vancouver’s population projections are based largely on Census data base counts and trend demographic indicators, and how those trend indicators may evolve in the future. A cohort survival model is used to coordinate the relationships among the component demographic indicators and dynamics: natural increase births minus deaths; international immigration and emigration flows; domestic migration flows to and from other areas of British Columbia (intra-provincial migration) and Canada (inter-provincial migration); and intermunicipal migration as residents move among municipalities within Metro Vancouver.
From a 2016 base population of 2,570,000, it is anticipated that the population will increase by about 1 million to 3,600,000 by the year 2050.
Future immigration will be the primary variable affecting future population growth and related, housing, employment and land use considerations in Metro Vancouver. Assumptions for the future number of immigrants to Canada choosing to settle in the region are based on the following:
- Federal immigration policy and annual admission quotas; historic regional trends in the annual share of Canada immigration settling in BC and Metro Vancouver.
- Emigration of persons leaving Metro Vancouver to live in other countries.
- Historic trends in the municipal share of Metro Vancouver settlement destinations for immigrants by age and sex, as indicated by Census mobility data.
Within Metro Vancouver’s Growth Model, the net annual number of immigrants projected for Metro Vancouver is estimated for each projection year, and allocated by gender, single year of age and trend distribution share to each member jurisdiction. It is assumed that the gender and age structure of immigrants and emigrants will remain relatively constant over time, i.e. that Federal immigration policies will maintain approximately 300,000 persons per year for Canada over the short term, with gradual increases based on the aging profile of the national population, economic sector change and labour force demand. The Metro Vancouver share of Canada’s immigration (currently about 11%) is assumed to marginally decrease as larger shares of immigrants settle in other areas of Canada and elsewhere within BC. Therefore, net immigration settling in Metro Vancouver is assumed to be in the 30,000 to 40,000 per year range through the projection period.
Within Metro Vancouver, municipal allocation trends are assumed to continue within the 5 to 10-year term, with a gradual shift toward a more balanced share / distribution of immigrant settlement in relation to overall population growth capacity in each member jurisdiction. The data trends show that the City of Vancouver has accommodated the region’s largest share of recent immigrants over the past 20 years, but has declined substantially from 36% to 30% over that period. Much of this reallocation has been to the City of Surrey which has increased from 13% to 22% over that period, as well as toward a broader distribution among other municipalities.
Alternative scenarios, prepared using a number of identified drivers and disruptors, will consider the potential implications of factors such as climate change on population migration in the world and potential implications for Metro Vancouver’s population growth.
Inter-provincial migration includes the annual number of persons moving to or from Metro Vancouver / each municipality and other provinces in Canada. Trends in the rates of inter-provincial migration primarily relate to the comparative strength of the regional economy, employment opportunities and lifestyle choices in Metro Vancouver versus other regions in Canada. Net inter-provincial migration in the Metro Vancouver region generally ranges between -5,000 and +5,000 residents per year. However, while the overall regional net flow is relatively minor in overall regional growth projections, there has been an average regional in-migration of 12,000 per year and out-migration 11,000 per year over the past 15 years with varying impacts for each municipality.
Projecting future housing demand is directly related to the trends and projections in household formation characteristics of the projected population and dwelling choices of those households. Two basic indicators for household formation are the household maintainer rates with the population and average household size.
Average household size is the typical number of persons occupying a dwelling unit, and can be further specified to the location, structure type and other characteristics of dwellings or households. In 2016, the overall average household size for Metro Vancouver was 2.60 persons per private occupied unit (including Census undercount estimates) ranging from 3.2 for a single detached dwelling to 1.93 for an apartment. For example, a population aged 15+ (non-institutional) of 2.17 million would be multiplied by a household maintainer rate of 0.45 (45%), or an average household size of 2.6, to estimate about 975,000 projected dwelling units.
Patterns in household maintainer rates and household size vary over time, affected by changing demographics (e.g. baby boomers’ life cycle, changes to immigration), as well as changing external factors affecting housing choice (e.g. household incomes, housing costs and availability).
Based on population projections by age cohort, and trends in household formation rates, total housing demand and dwelling structure type are projected for Metro Vancouver and for each municipality, with consideration for the land use and development / density plans prepared by each municipality, knowledge and advice from municipal planners, and overall land base and development potential within the municipalities.
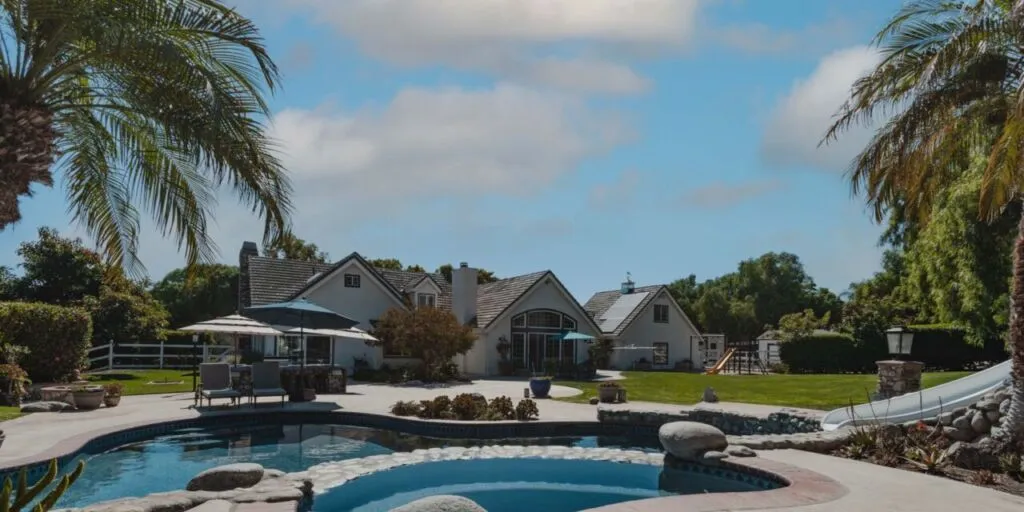
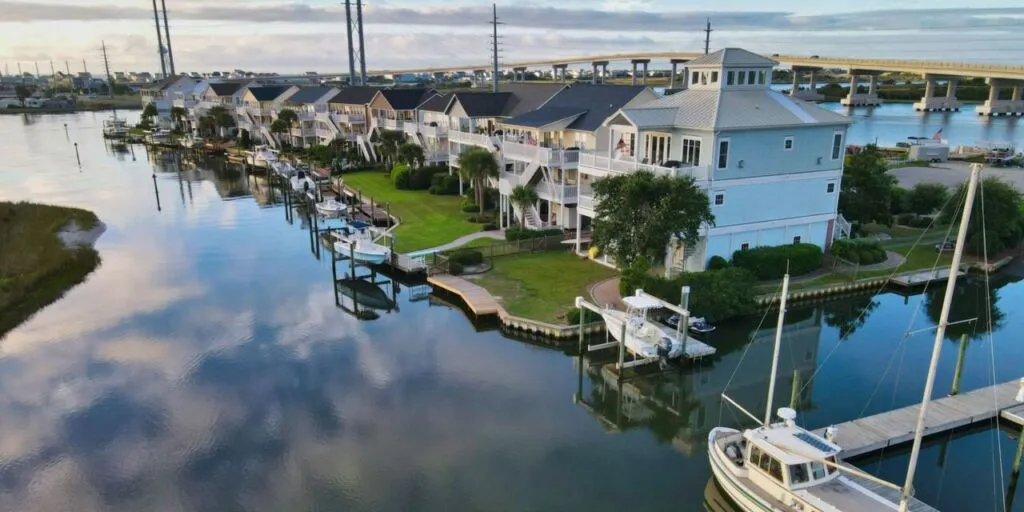
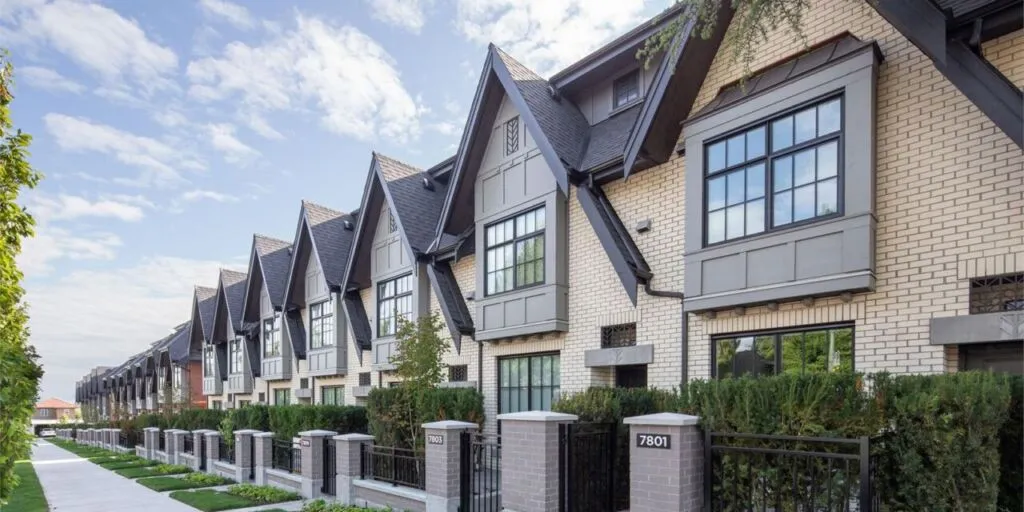
Housing development throughout the region is distinctly trending toward increasingly dense multiunit forms, with apartments comprising about 60% of new housing growth. Many municipalities have revised development plans and allowable densities for various types of more intense housing development in urban centre areas, major transit locations, as well as redevelopment / intensification of existing and new urban neighbourhoods.
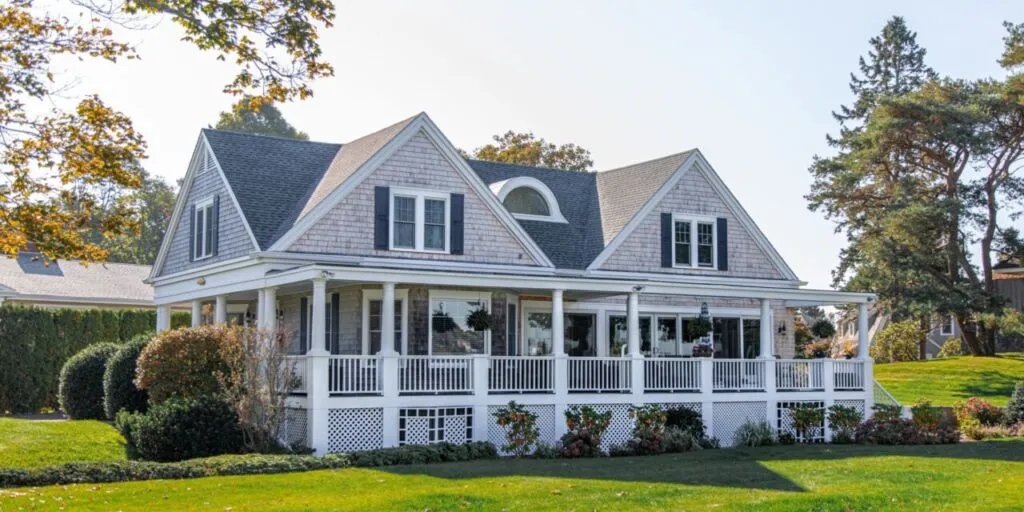
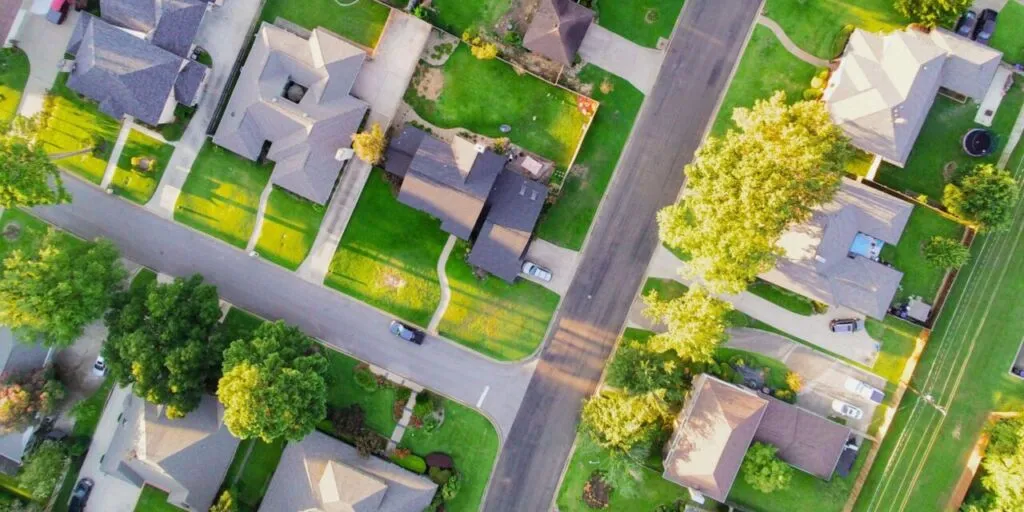
By about 2030-2035 all new housing development will be through redevelopment and intensification of the existing urban land base. This likely will take the form of apartments in and around the core areas (i.e. urban centres and transit station / corridors) and various forms of housing intensification replacing aging single detached dwellings within many existing urban neighbourhoods and throughout the region.
By 2050 the region’s projected population of 3.6 million is expected to require about 1.4 million dwelling units. It is anticipated that apartments will continue to take about 62% of new unit growth, increasing the share of the housing stock from 42% to 57%. The other primary source of housing growth, i.e. the redevelopment of the existing single detached dwellings into hybrid forms (e.g. accessory units, x-plexes, laneway units, etc.), will take about 38% of new unit growth, increasing the share of housing stock from about 29% to 34%. The share of single detached units is projected to decrease from 29% to 15% of the total housing stock through the same period. Projections beyond 2050 assume that the land base will remain stable, the forms development will continue and that increasing intensification and resulting densities will be accommodated.
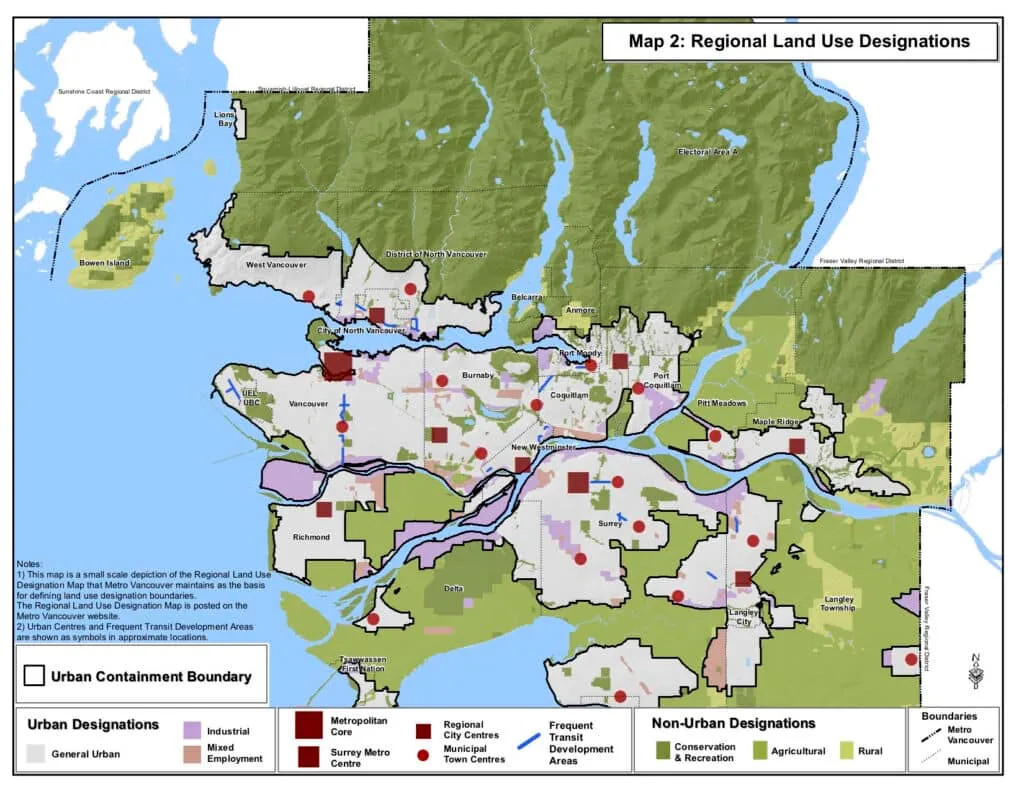
It is assumed that the existing land base for growth as set out in Metro 2040 can accommodate the projected population / housing demand through the projection period. The Metro 2040 growth concept has been incorporated into the respective municipal OCPs to contain 99% of housing growth within the UCB, to have about 40% of new dwelling units within designated Urban Centres, 28% along major transit corridors, and about 30% through intensification of the remaining urban-designated areas. The relative shares of housing growth within each municipality will vary according to the number of Urban Centres, the major transit services available, the availability of undeveloped urban lands, and housing intensification patterns.
There are currently about 6,000 hectares of lands designated General Urban within the UCB that are currently undeveloped or rural and planned for future urban growth. Over the past 20 years Metro Vancouver’s growth has been about 20% through new urban development and 80% through intensification of the established / developed areas. It is assumed that the remaining urban lands within the UCB will be largely developed over the next 15-20 years.

